After completing the AWS Certified Solutions Architect certification, I wanted to build something AWS related that was not just another "deploy a web app on EC2" project.
I wanted something that touched real infrastructure skills like networking, availability, images, scaling, load balancing, logs, and monitoring. DNS felt like a good target because it is one of those systems that looks simple from the outside and then immediately becomes much more interesting once you actually try to run it.
So I built a highly available recursive DNS resolver on AWS using Unbound.
The basic idea is simple is clients send DNS queries to a Network Load Balancer, the NLB forwards those queries to healthy EC2 instances created by an Auto Scaling Group, Unbound answers the queries, and each instance ships query logs into a centralized CloudWatch Logs group. And fromr there, CloudWatch Logs Insights gives me an analytics dashboard for things like top queried domains, top clients, query types, TLDs, and suspiciously long TXT queries.
I am not pretending this is a production-ready DNS for a company. The point was to practice how the AWS pieces fit together and to make the result observable enough that I could actually understand what was happening.
The problem I wanted to solve
Running one DNS resolver on one VM is easy enough.
The more interesting question is what happens when that VM needs an update, fails, or gets replaced?
For this project, I wanted the DNS endpoint to stay stable even if individual EC2 instances changed behind the scenes. I also wanted to avoid manually configuring every server from scratch every time a new instance launched.
That led to a few requirements:
- Clients should query one stable endpoint.
- EC2 instances should be replaceable.
- New resolver instances should come up already configured.
- Updates should not require rebuilding the entire setup by hand.
- Query logs should be centralized instead of trapped on individual instances.
- The logs should be useful enough to answer basic questions about DNS traffic.
That is where the Golden AMI, Launch Template, Auto Scaling Group, Network Load Balancer, and CloudWatch setup came in.
Architecture
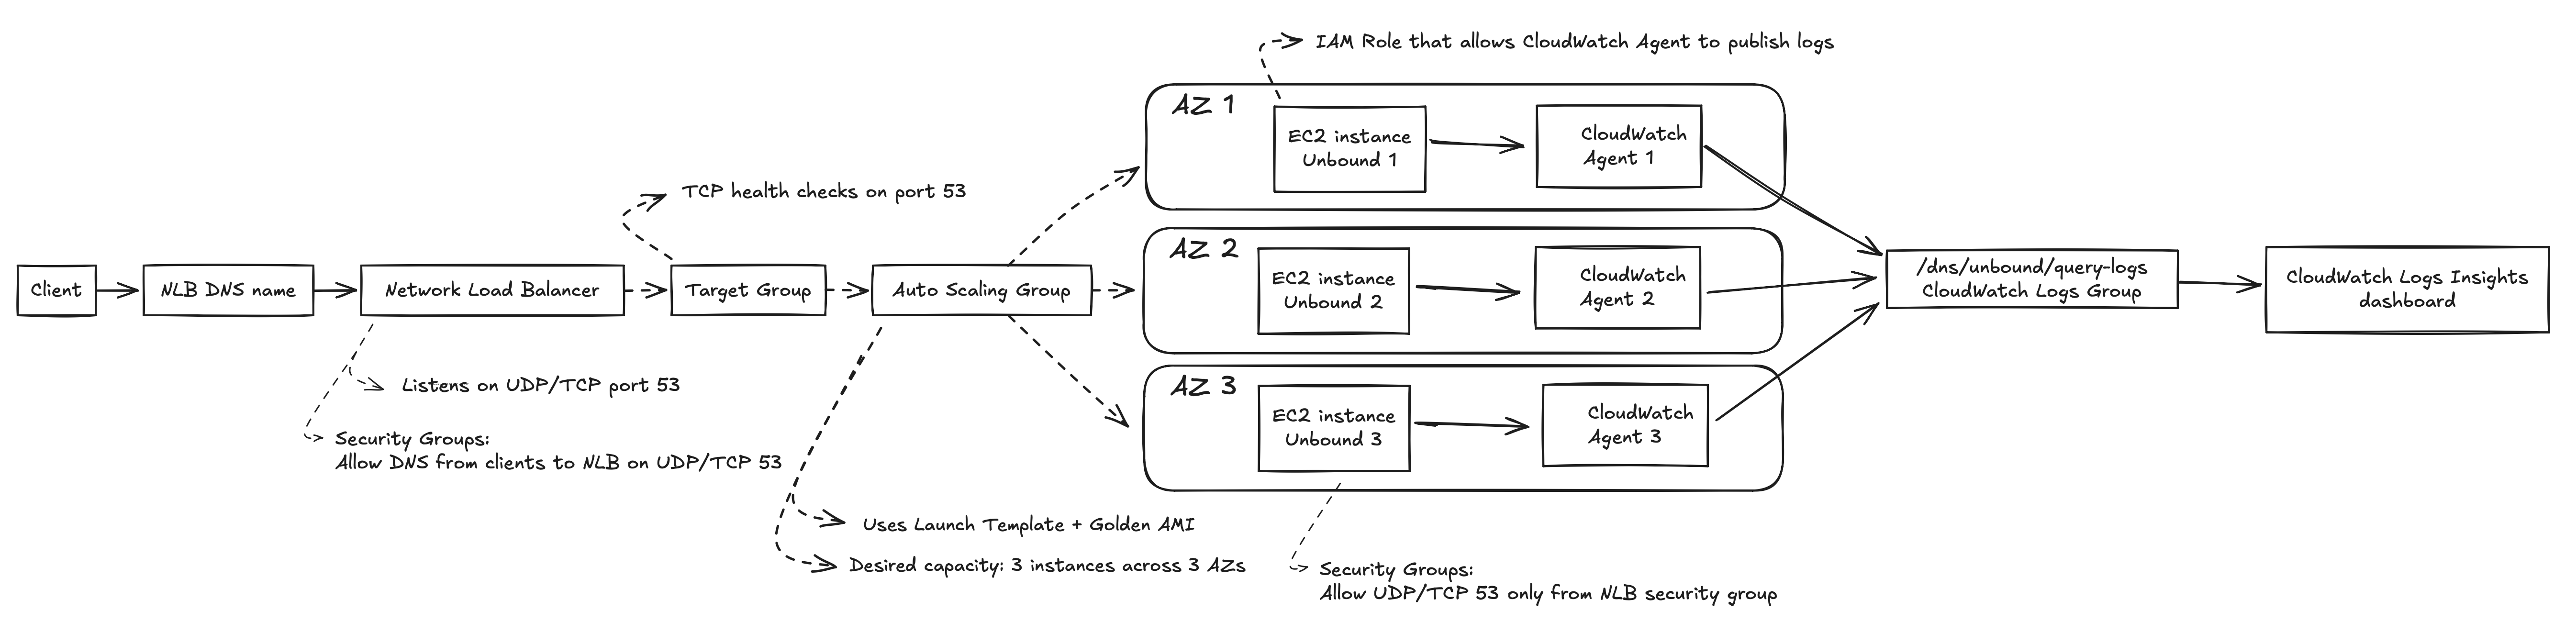
Figure 1. Detailed AWS architecture for the highly available DNS resolver.
In plain English:
- A client sends a DNS query to the DNS name of the Network Load Balancer.
- The NLB receives the traffic on port 53.
- The NLB forwards the query to a healthy EC2 instance in the target group.
- That EC2 instance runs Unbound and answers the DNS query.
- Unbound writes query logs locally through syslog.
- The CloudWatch Agent ships those logs to CloudWatch Logs.
- CloudWatch Logs Insights queries turn those raw logs into useful DNS analytics.
The setup was spread across three Availability Zones through the Auto Scaling Group.
The main AWS components
Golden AMI
The Golden AMI is the base image I prepared before launching the Auto Scaling Group.
Instead of booting a blank Linux instance and manually installing everything during startup or using a User Script which would make startup time for new instances very long, I built an AMI that already had the important pieces installed and configured:
- Linux updated
- Unbound installed
- Unbound configured
- CloudWatch Agent installed
- CloudWatch Agent configured to ship Unbound query logs
This made new instances much more predictable. When the Auto Scaling Group launches an instance, it is not starting from zero. It starts from an image that is already configured to be a DNS resolver.
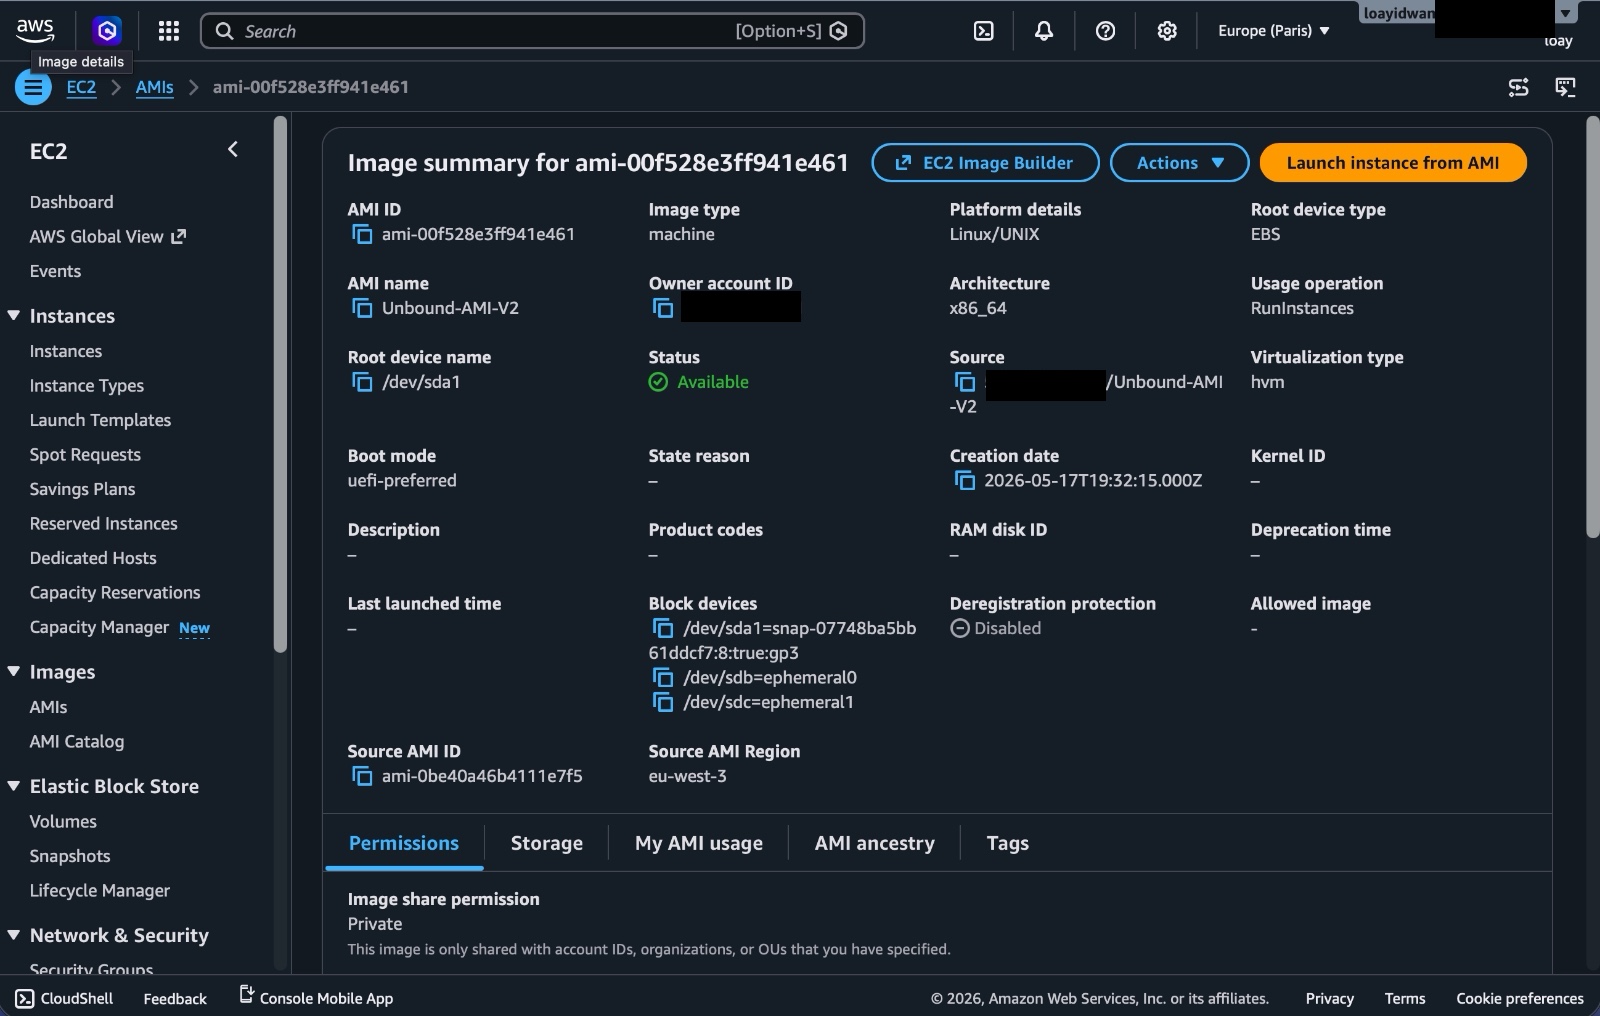
Figure 2. Golden AMI used as the base image for new resolver instances.
This is also a good way to practice the image-based deployment model. In a more mature setup, I would automate the AMI build using something like EC2 Image Builder instead of creating it manually.
Launch Template
The Launch Template tells AWS how to create new EC2 instances.
In this project, the important part is that the Launch Template points to the Golden AMI. It also defines the instance type, networking settings, security group, and other launch configuration details.
The Launch Template is basically the recipe. The Auto Scaling Group uses that recipe whenever it needs to create or replace an instance.
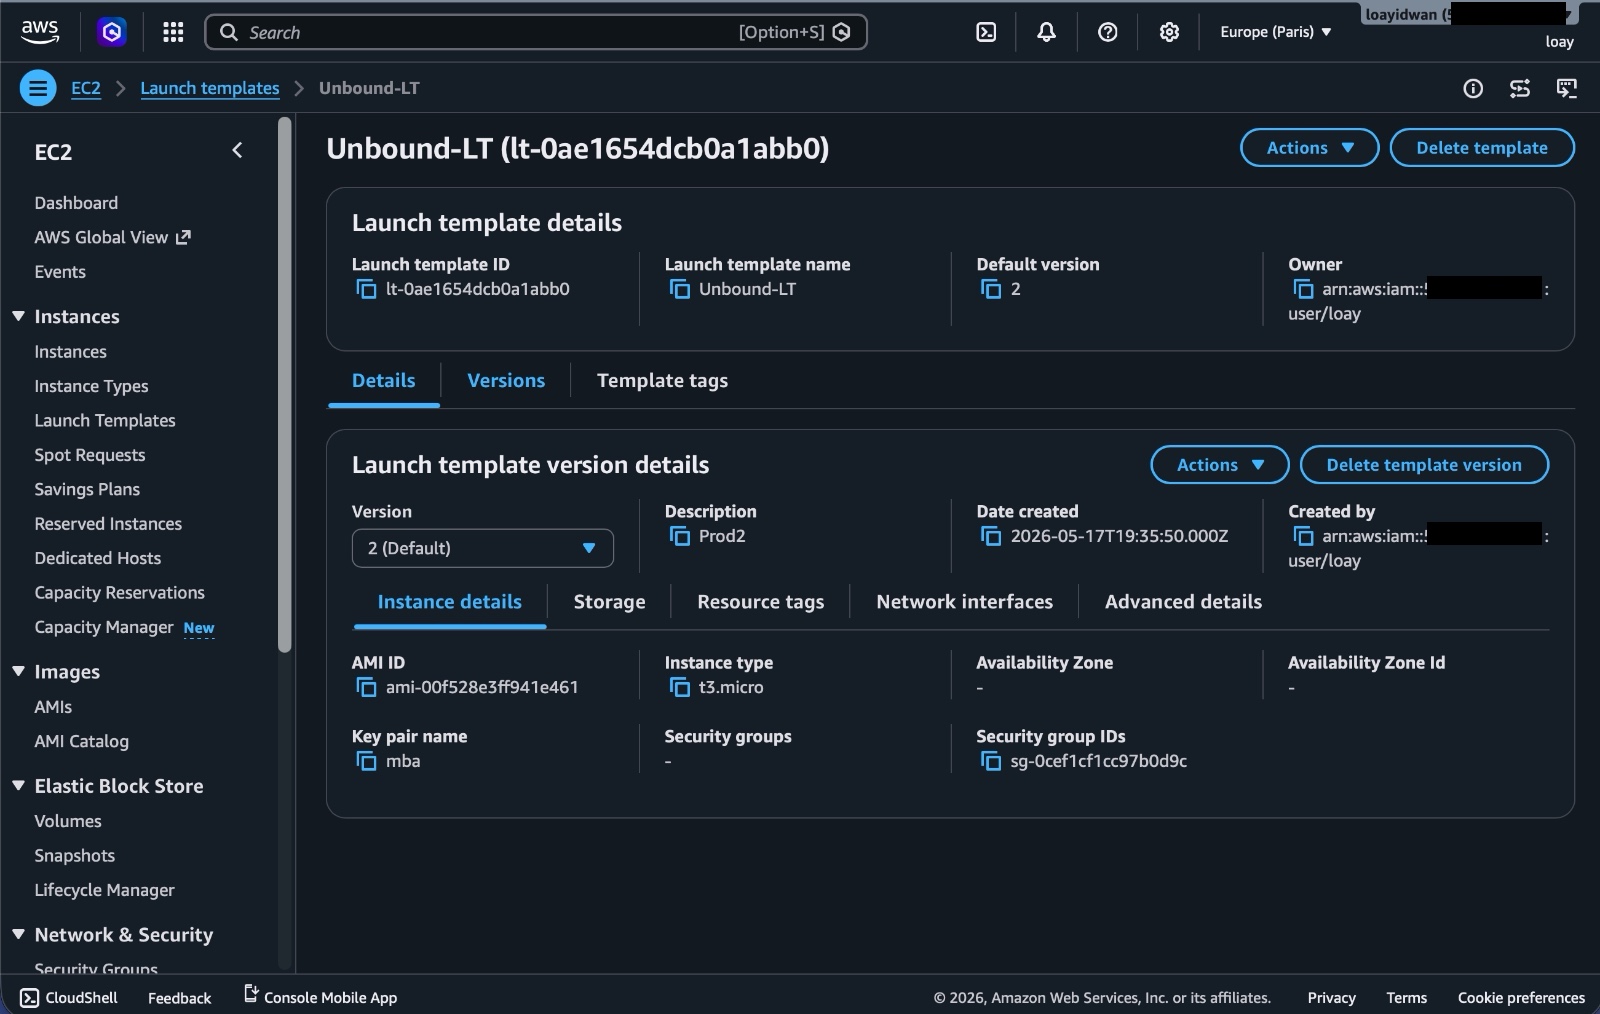
Figure 3. Launch Template used by the Auto Scaling Group to launch resolver instances.
Auto Scaling Group
The Auto Scaling Group is responsible for keeping the resolver fleet alive.
I configured it to launch instances from the Launch Template across multiple Availability Zones. If an instance becomes unhealthy or needs to be replaced, the ASG can launch another one automatically.
One important detail here is instance refresh behavior. I wanted updates to be less disruptive, so the ASG was configured around the idea of launching replacement instances before terminating old ones. That matters because DNS is a service where even a short outage is very noticeable.
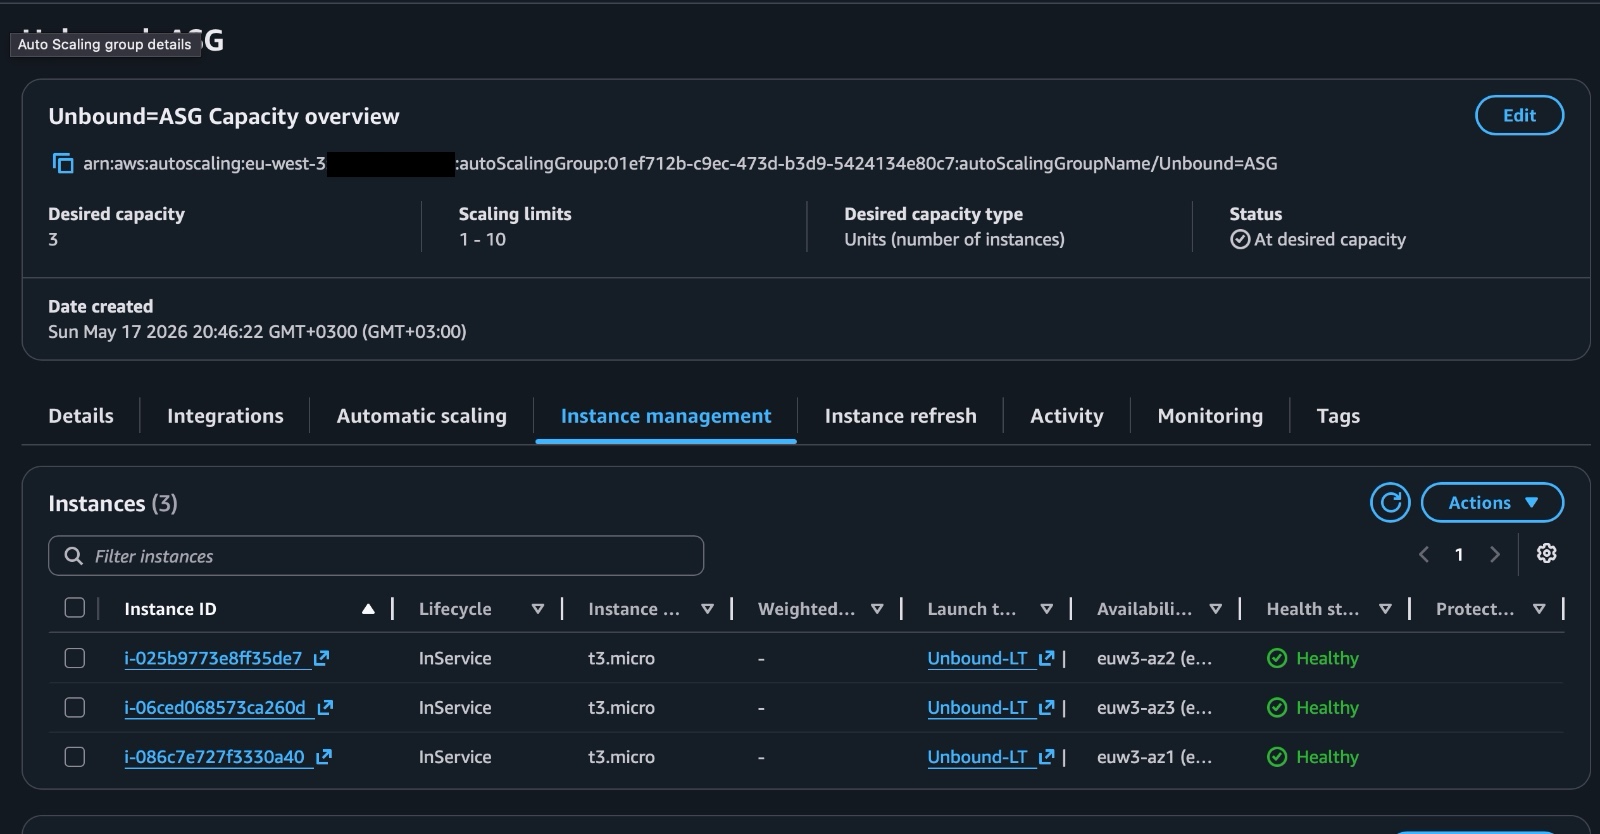
Figure 4. Auto Scaling Group instance management view showing the resolver instances spread across Availability Zones.
Target Group
The Target Group is the list of EC2 instances that the Network Load Balancer can send traffic to.
The Auto Scaling Group is connected to the Target Group, so instances launched by the ASG are registered as targets. When instances are removed or replaced, they are deregistered as well.
The load balancer does not need to know about individual instances forever. It talks to a target group, and the Auto Scaling Group keeps that target group populated with healthy machines.
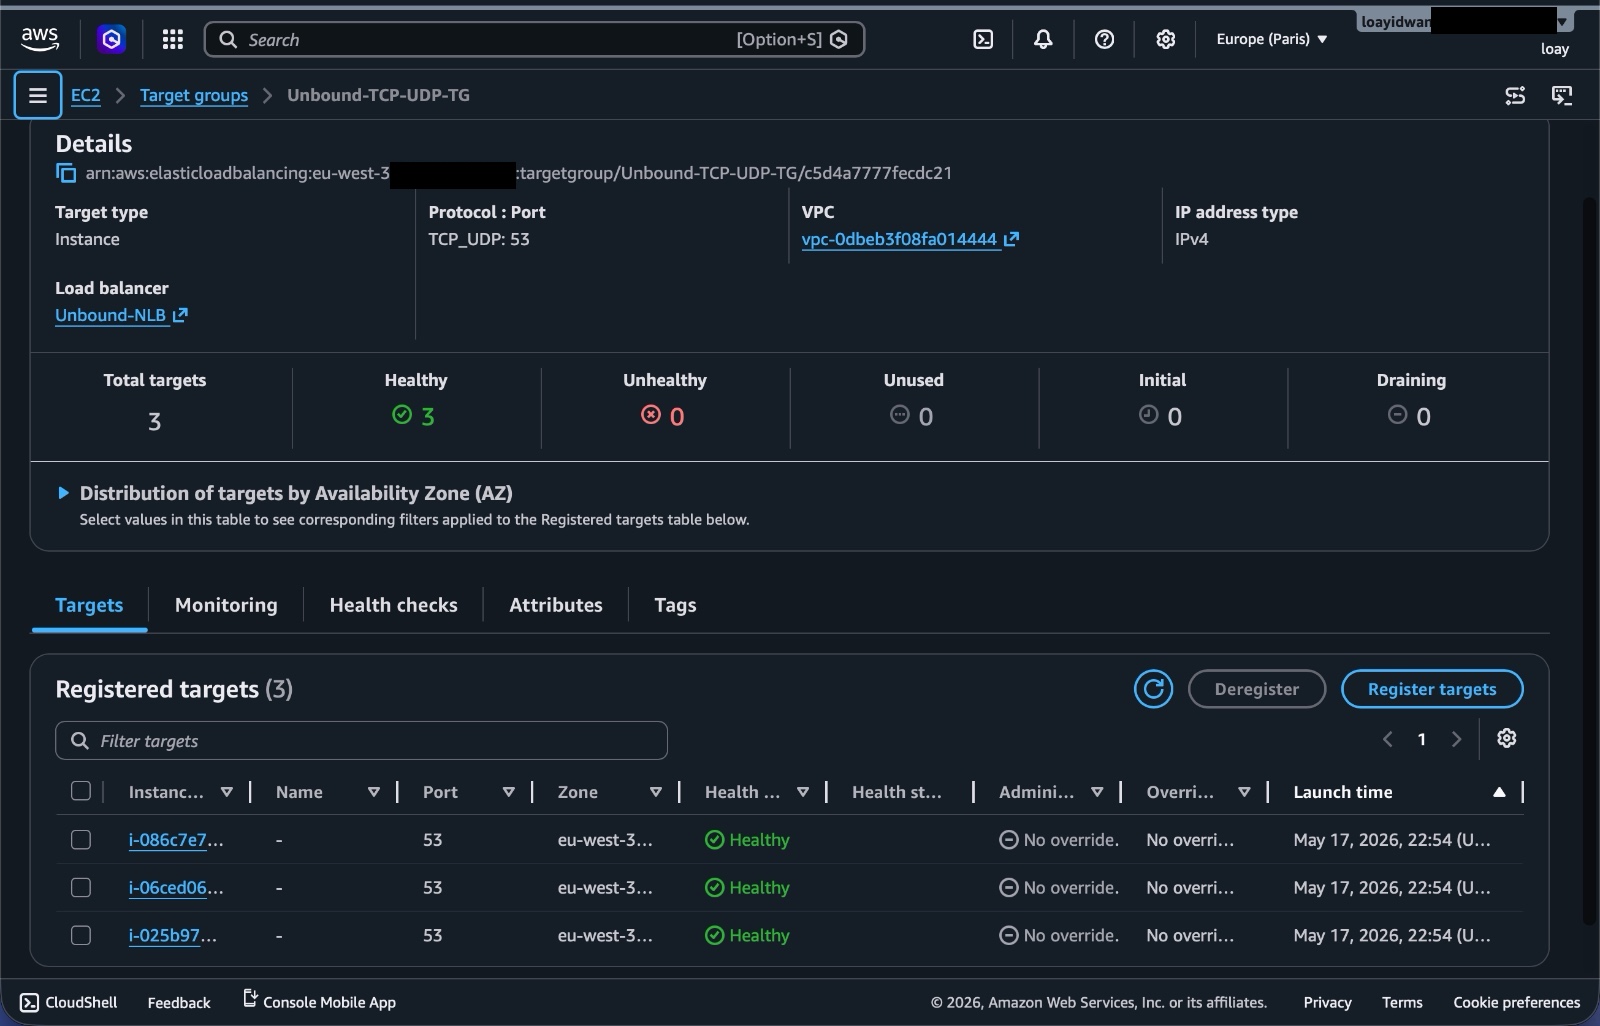
Figure 5. Target Group view showing healthy Unbound resolver targets behind the load balancer.
Network Load Balancer
The Network Load Balancer sits in front of the DNS resolver instances.
I used an NLB because DNS traffic is a layer 4 use case. The NLB gives the project a stable DNS name and public load-balanced entry point while forwarding traffic to the EC2 targets behind it.
One important thing that is that the NLB has its own public addresses. The EC2 instances behind it may also have public IPs in this lab, but clients should not query those instance IPs directly.
The client-facing endpoint is the NLB DNS name.
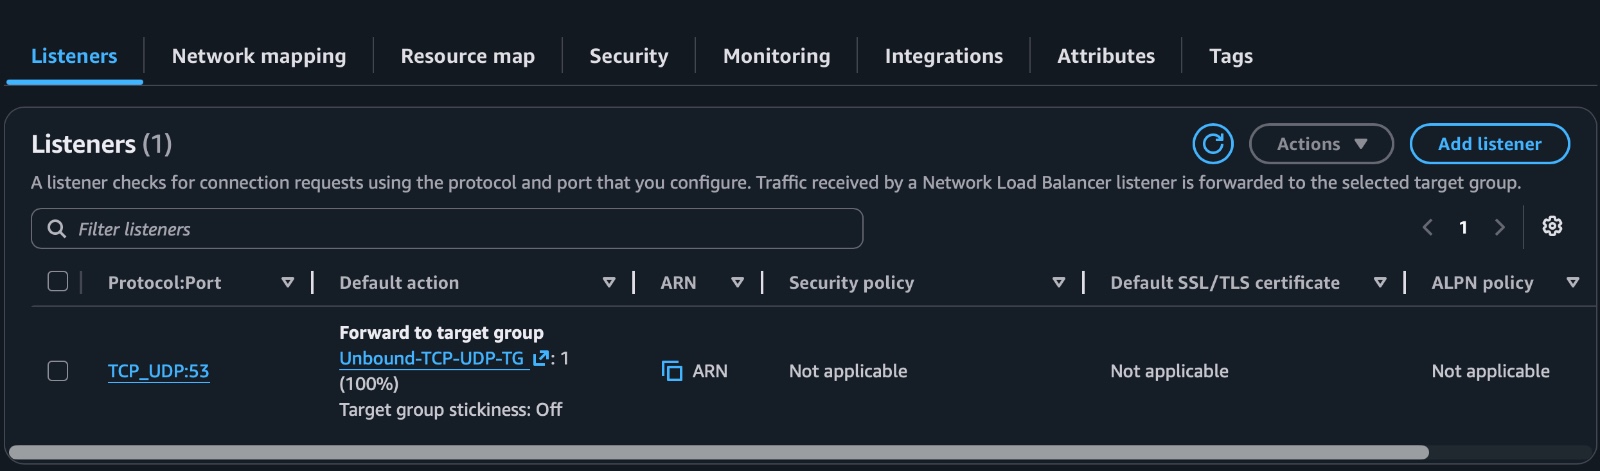
Figure 6. NLB listener forwarding DNS traffic on port 53 to the resolver target group.
That separation is the whole point. Instances can be replaced, but the client still has one stable place to send DNS queries.
Unbound
Unbound is the recursive DNS resolver running on each EC2 instance.
When a query reaches an instance, Unbound handles the DNS lookup and returns the answer. It also logs the query so I can later analyze traffic patterns in CloudWatch.
I chose Unbound because it is a serious DNS resolver, widely used, and configurable.
CloudWatch Agent
The CloudWatch Agent runs on each EC2 instance and ships Unbound query logs to CloudWatch Logs.
Without this, the logs would stay on individual instances. That becomes annoying very quickly in an Auto Scaling setup because instances are temporary. If an instance is replaced, its local logs can disappear with it.
Centralizing logs is what made the observability part of this project possible.
CloudWatch Logs Insights dashboard
The query logs land in this log group:
/dns/unbound/query-logs
From there, I used CloudWatch Logs Insights to build dashboard widgets for:
- top queried domains
- top clients making DNS queries
- DNS query volume over time
- top query types
- top queried TLDs
- long TXT queries by client
This was one of the most useful parts of the project because DNS logs can reveal a lot.
Query flow
The request path looks like this:
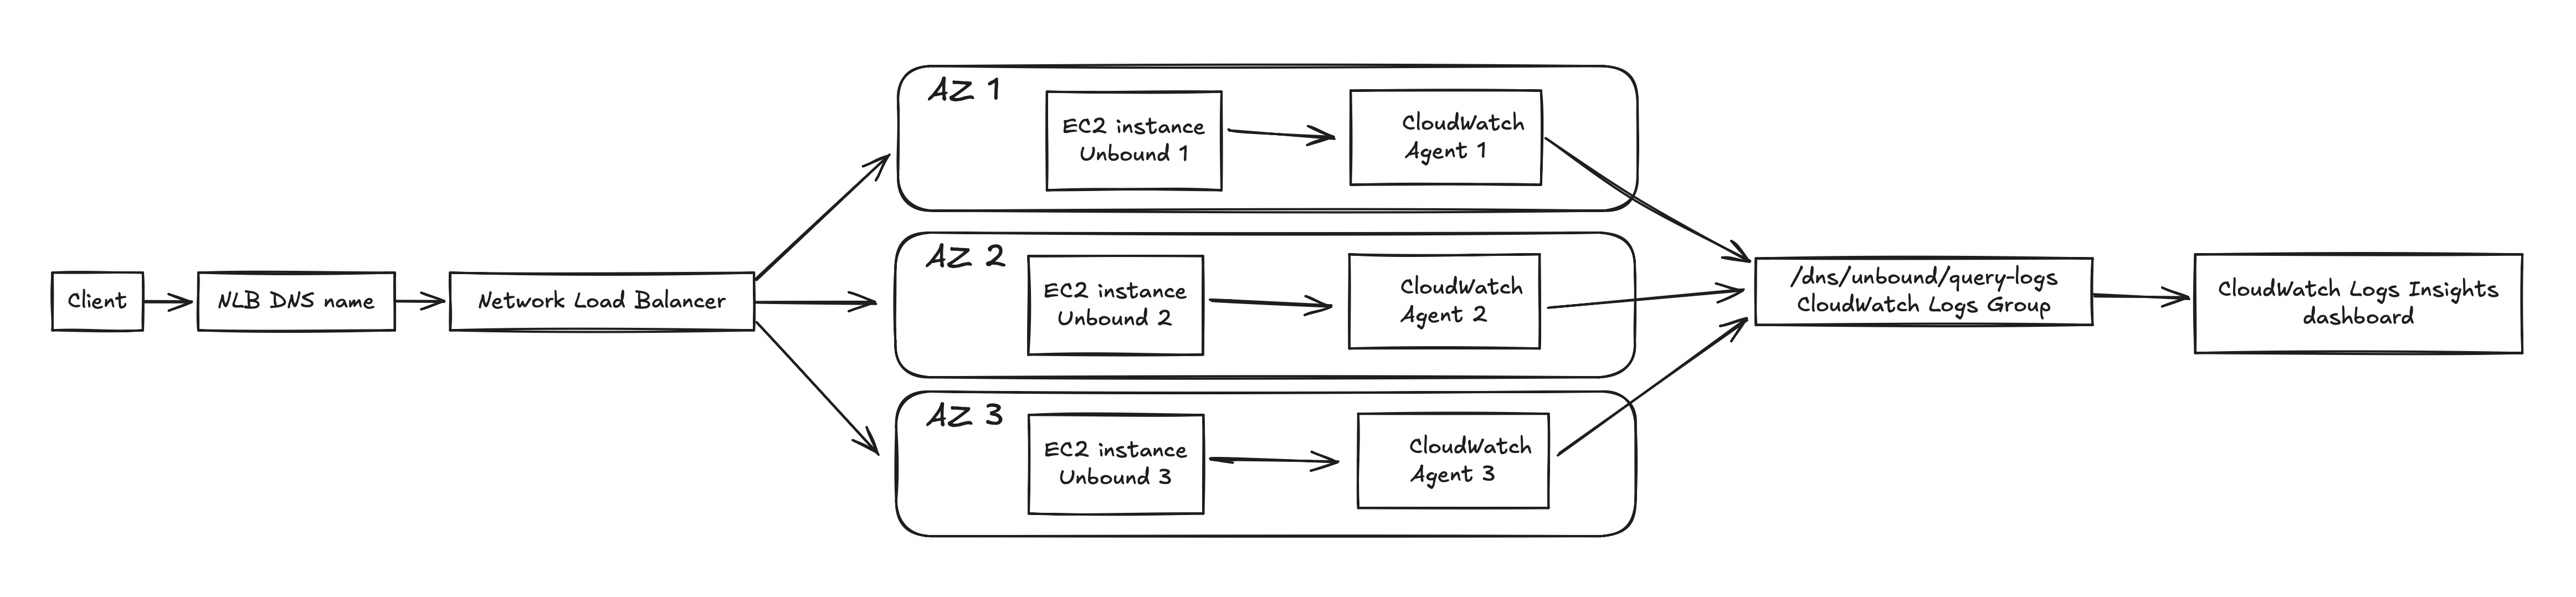
Figure 7. DNS query and logging flow.
The client does not know which EC2 instance answers the query, and it should not need to know.
That is the main benefit of putting the resolver behind the NLB and ASG. The individual EC2 instances become implementation details. If one instance is replaced, the service endpoint stays the same.
The NLB forwards traffic to healthy targets. One of the EC2 instances receives the query, Unbound answers it, and the local log entry eventually ends up in CloudWatch.
The Unbound configuration
This is the Unbound configuration I used for the resolver:
server:
    # Listen on DNS port 53.
    port: 53

    # Listen on all IPv4 interfaces since ASG-created instances have dynamic IPs.
    interface: 0.0.0.0

    # Allow queries from localhost.
    access-control: 127.0.0.0/8 allow

    # Allow queries from the VPC.
    access-control: 172.31.0.0/16 allow

    # Temporary testing rule only.
    access-control: 0.0.0.0/0 allow

    # Deny IPv6.
    access-control: ::0/0 refuse

    # Basic hardening.
    hide-identity: yes
    hide-version: yes
    harden-glue: yes
    harden-dnssec-stripped: yes
    use-caps-for-id: yes

    # Performance/cache basics.
    prefetch: yes
    cache-min-ttl: 60
    cache-max-ttl: 86400
    msg-cache-size: 64m
    rrset-cache-size: 128m

    # Reduce junk.
    unwanted-reply-threshold: 10000

    # Logging.
    verbosity: 1
    log-queries: yes
    log-replies: no
    log-servfail: yes
    log-time-ascii: yes
    use-syslog: yes
There are a few important choices here.
Listening on 0.0.0.0
The resolver listens on 0.0.0.0:53 because the instances are created by an Auto Scaling Group and their private IPs are dynamic.
In a manually managed server, I could bind Unbound to one specific interface or IP. In this setup, I wanted the AMI to work no matter which instance the ASG launched. Listening on all IPv4 interfaces made that simpler.
That does not mean the resolver should be exposed to everyone. Binding to 0.0.0.0 only says where the process listens. Access still needs to be controlled with security groups, routing, and Unbound access-control rules.
Access control
The safe idea is to allow only the networks that should actually use the resolver.
Localhost and the VPC CIDR are allowed:
access-control: 127.0.0.0/8 allow
access-control: 172.31.0.0/16 allow
I also used this rule during testing:
access-control: 0.0.0.0/0 allow
That rule is very dangerous if left in place. It effectively allows any IPv4 client from Unbound's point of view, so it should be treated as a temporary testing shortcut, not a final configuration.
The setup should not become a public open resolver. Open recursive resolvers can and probably will be abused.
Basic hardening
These settings reduce the amount of information Unbound exposes and enable some DNS hardening behavior:
hide-identity: yes
hide-version: yes
harden-glue: yes
harden-dnssec-stripped: yes
use-caps-for-id: yes
hide-identity and hide-version stop the resolver from advertising details about itself.
harden-glue and harden-dnssec-stripped help protect against certain DNS response problems.
use-caps-for-id adds extra query randomization by changing letter casing in domain names.
Cache settings
These settings control basic caching behavior:
prefetch: yes
cache-min-ttl: 60
cache-max-ttl: 86400
msg-cache-size: 64m
rrset-cache-size: 128m
Caching is one of the main reasons to run a resolver in the first place. If clients repeatedly query the same domains, the resolver can answer from cache instead of repeating the full lookup every time.
The cache values here are reasonable for a project, but I would tune them more carefully for a real environment based on memory, traffic, and expected query patterns.
Logging
This project needed logs, so query logging was enabled:
verbosity: 1
log-queries: yes
log-replies: no
log-servfail: yes
log-time-ascii: yes
use-syslog: yes
log-queries: yes is what makes the analytics possible.
I left log-replies disabled because logging every response would add much more noise and cost. For this project, I mostly cared about who queried what and when.
log-servfail: yes is useful because SERVFAIL spikes can point to resolver issues, upstream DNS problems, DNSSEC validation problems, or broken domains.
Security considerations
The biggest security point is simple: this should not be an open public resolver.
There are two layers I cared about.
Security groups and network access
The EC2 instances should only accept DNS traffic from the intended path.
In this architecture, clients query the NLB DNS name. The EC2 instances are targets behind the NLB. Clients should not query individual EC2 public IPs directly.
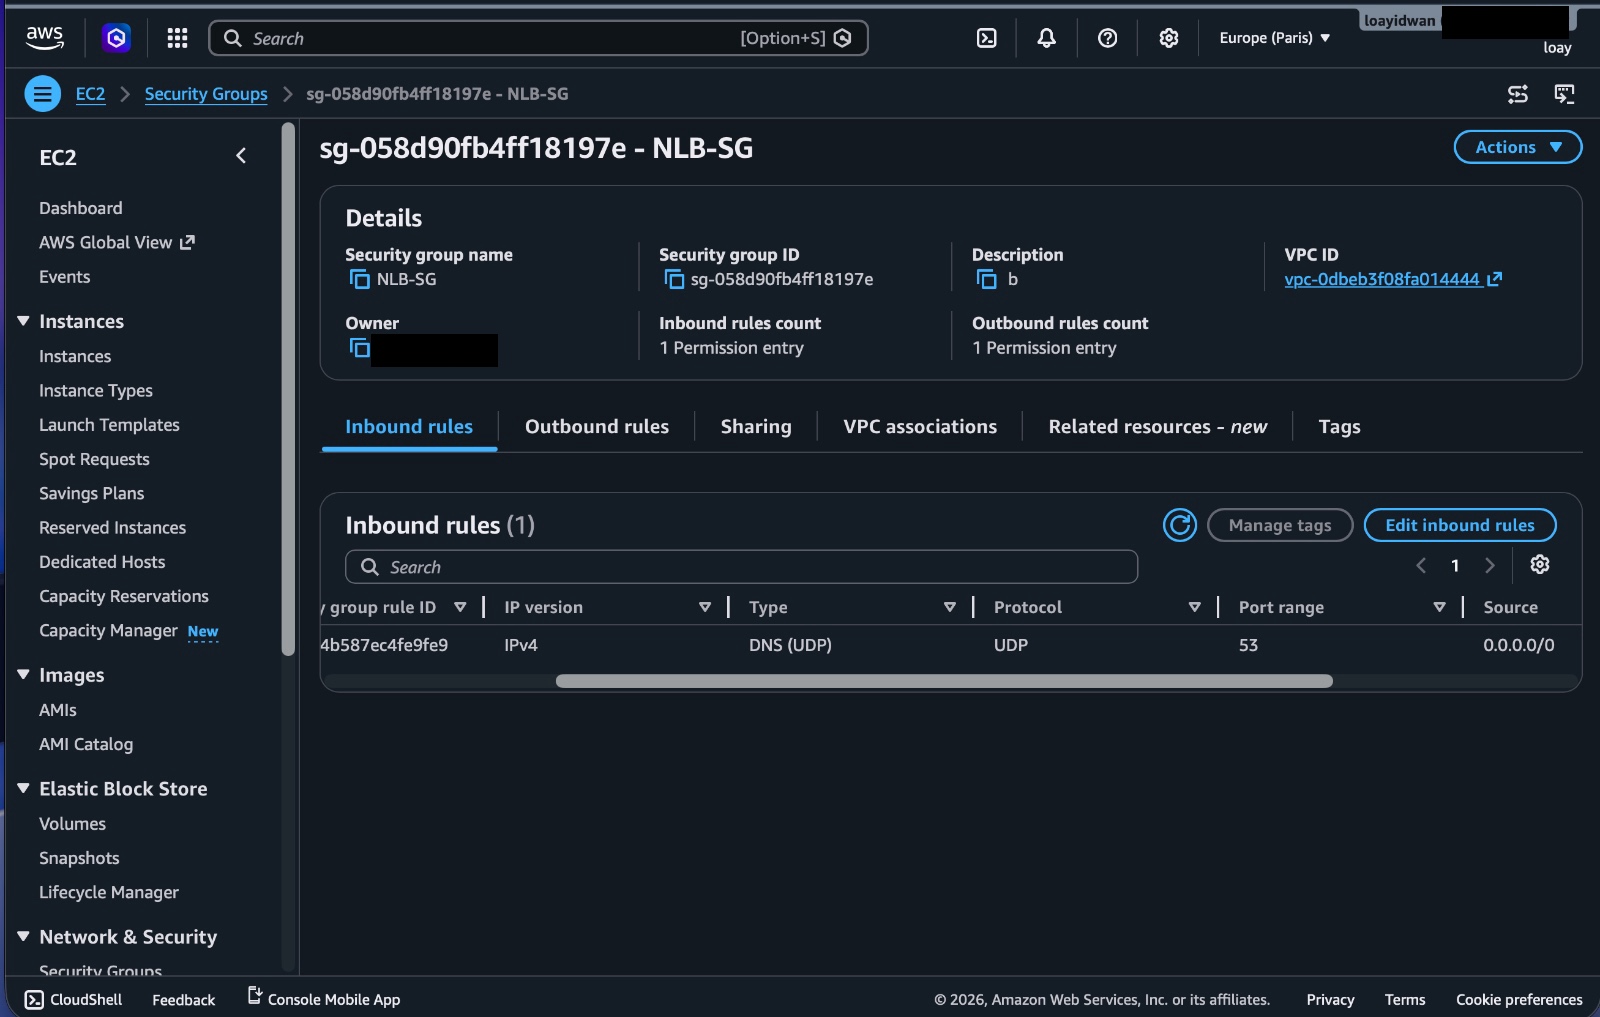
Figure 8. Network Load Balancer security group allowing DNS traffic to the public entry point.
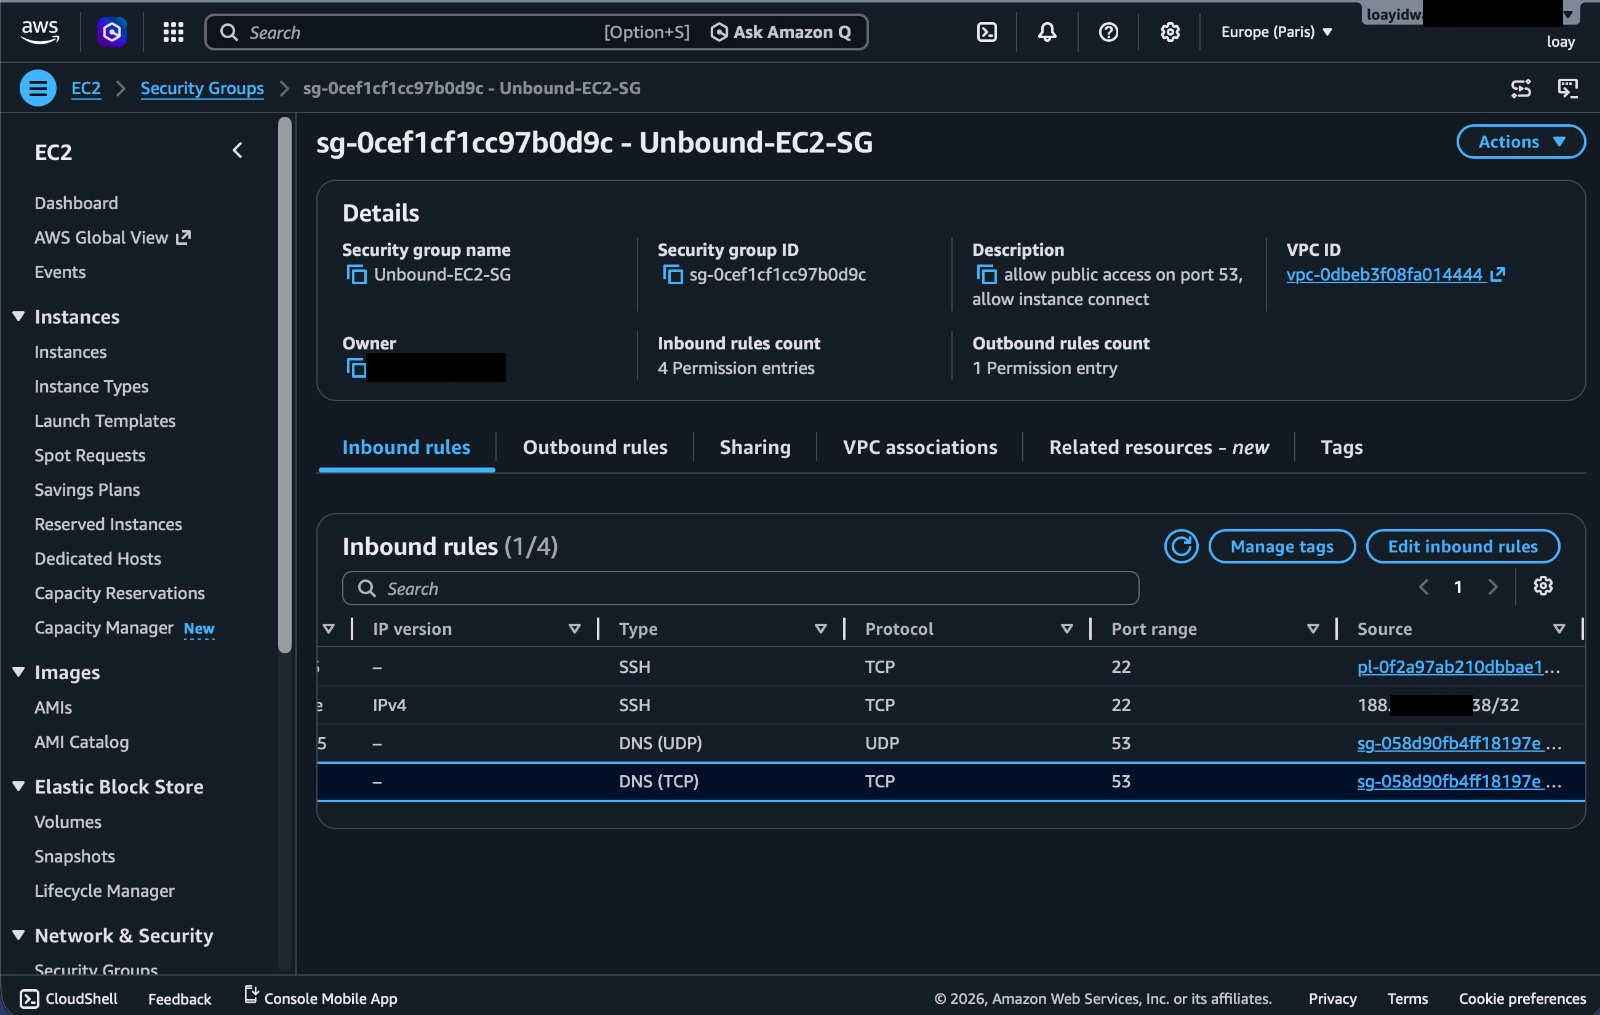
Figure 9. EC2 resolver security group controlling access to the Unbound instances.
For a stronger version of this design, I would put the resolver instances in private subnets with no public IPs at all. The NLB would be the public entry point, and the instances would only be reachable through the load-balanced path.
Unbound access-control
Unbound should also enforce its own allowlist.
Even if the AWS security group is correct, I do not want the resolver software to blindly accept queries from everywhere.
The 0.0.0.0/0 allow line was useful while testing, but it is not a production-safe setting. The final allowlist should be narrowed to the actual client networks that need to use the resolver.
Defense in depth is the goal here. Security groups restrict traffic before it reaches the instance, and Unbound restricts what the resolver itself will answer.
Observability
DNS logs are useful because DNS is often the first place where application behavior shows up.
Before an app connects to an API, it usually resolves a domain. Before a device talks to an update server, telemetry endpoint, CDN, or random background service, DNS often sees it first.
For this project, all resolver instances ship query logs into:
/dns/unbound/query-logs
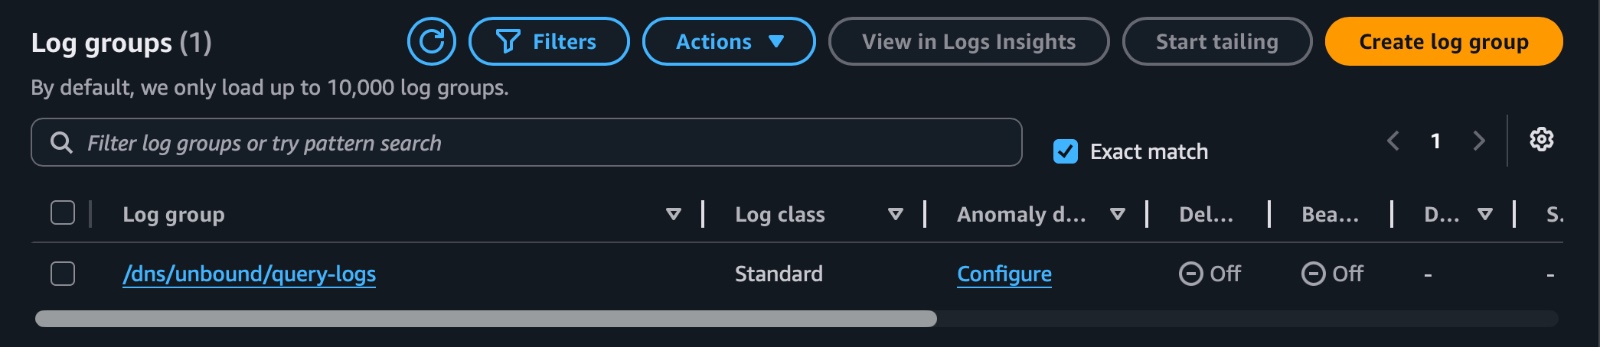
Figure 10. CloudWatch Logs group where the resolver instances publish Unbound query logs.
The exact parsing depends on how your distro and syslog format the Unbound log line, but the pattern I used was based on Unbound query log messages that include the client IP, domain, query type, and class.
Most of my Logs Insights widgets started with this parse shape:
fields @timestamp, @message
| filter @message like /info:/
| parse @message /info: (?<client>\d{1,3}(?:\.\d{1,3}){3}) (?<domain>[^ ]+) (?<qtype>[A-Z0-9]+) IN/
From there, I could build the dashboard.
Top queried domains
fields @timestamp, @message
| filter @message like /info:/
| parse @message /info: (?<client>\d{1,3}(?:\.\d{1,3}){3}) (?<domain>[^ ]+) (?<qtype>[A-Z0-9]+) IN/
| stats count(*) as queries by domain
| sort queries desc
| limit 25
This shows which domains are queried the most.
In a real environment, this can help identify common services, noisy devices, misconfigured software, or domains that deserve closer inspection.
Top client IPs
fields @timestamp, @message
| filter @message like /info:/
| parse @message /info: (?<client>\d{1,3}(?:\.\d{1,3}){3}) (?<domain>[^ ]+) (?<qtype>[A-Z0-9]+) IN/
| stats count(*) as queries by client
| sort queries desc
| limit 25
This answers a basic but important question, who is using the resolver the most?
If one client suddenly jumps far above everything else, that could be normal, or it could be a misconfiguration worth checking.
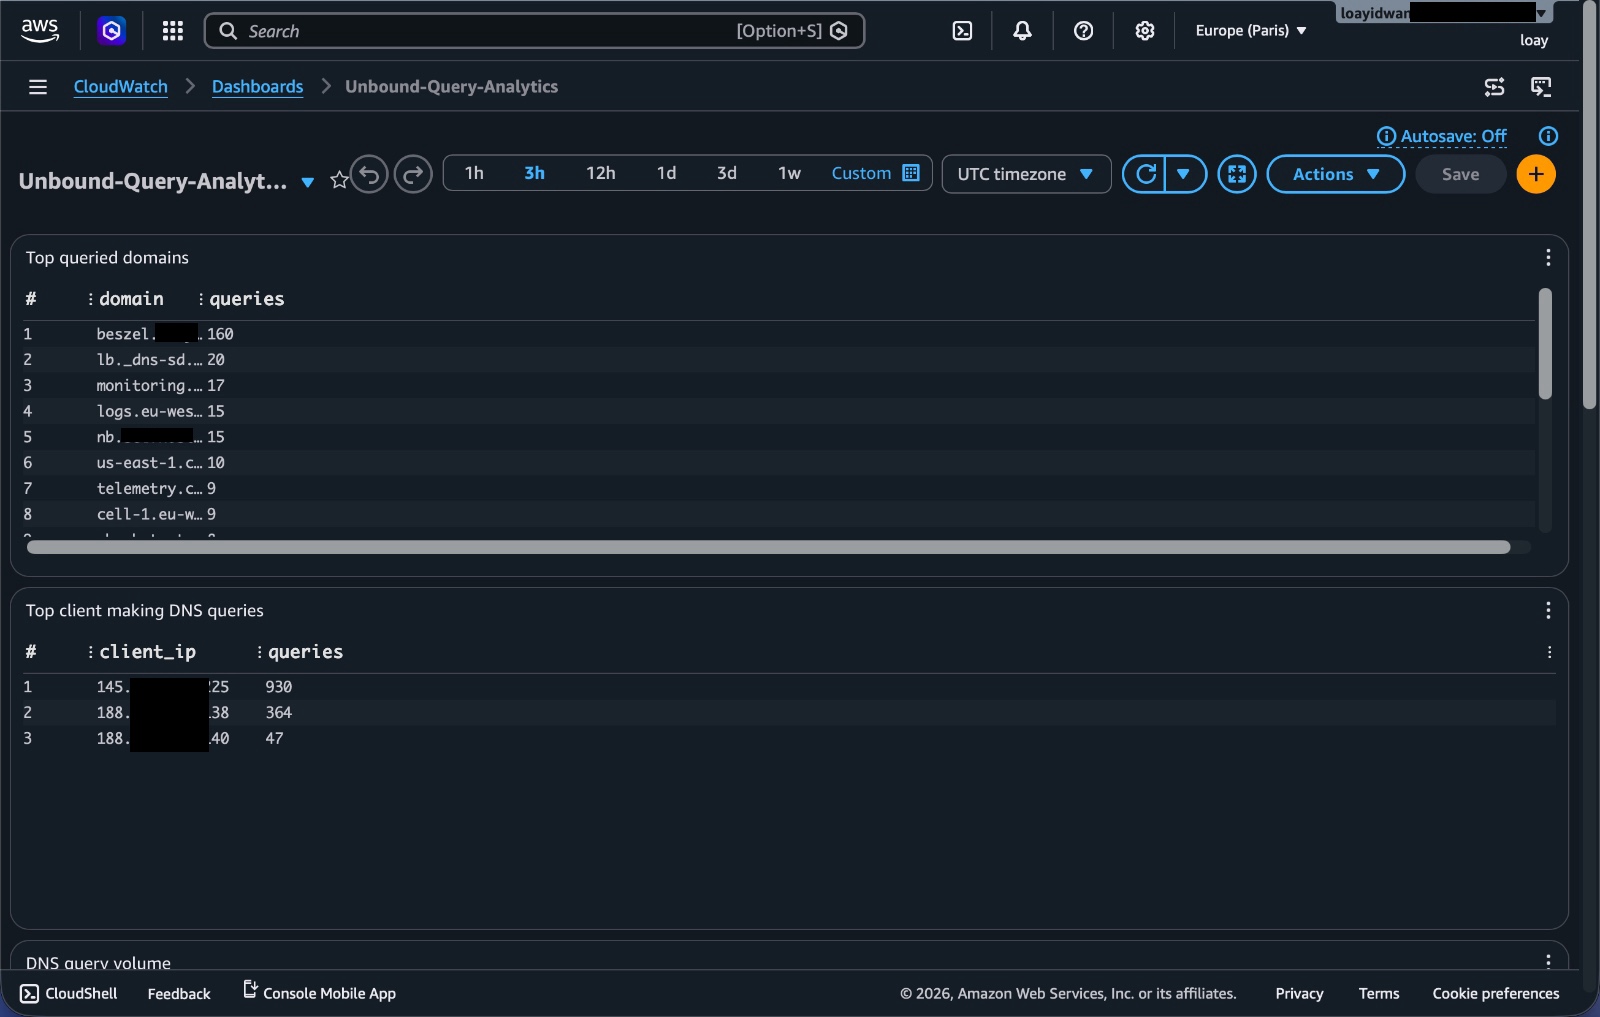
Figure 11. CloudWatch dashboard widgets for top queried domains and top client IPs.
Query volume over time
fields @timestamp, @message
| filter @message like /info:/
| parse @message /info: (?<client>\d{1,3}(?:\.\d{1,3}){3}) (?<domain>[^ ]+) (?<qtype>[A-Z0-9]+) IN/
| stats count(*) as queries by bin(5m)
| sort bin(5m) asc
This gives a simple time series of DNS traffic.
It is useful for spotting spikes, quiet periods, or traffic changes after configuration updates.
Top query types
fields @timestamp, @message
| filter @message like /info:/
| parse @message /info: (?<client>\d{1,3}(?:\.\d{1,3}){3}) (?<domain>[^ ]+) (?<qtype>[A-Z0-9]+) IN/
| stats count(*) as queries by qtype
| sort queries desc
| limit 20
This shows whether most traffic is A, AAAA, TXT, MX, HTTPS, or something else.
It is a small widget, but it gives a quick feel for what kind of DNS traffic the resolver is handling.
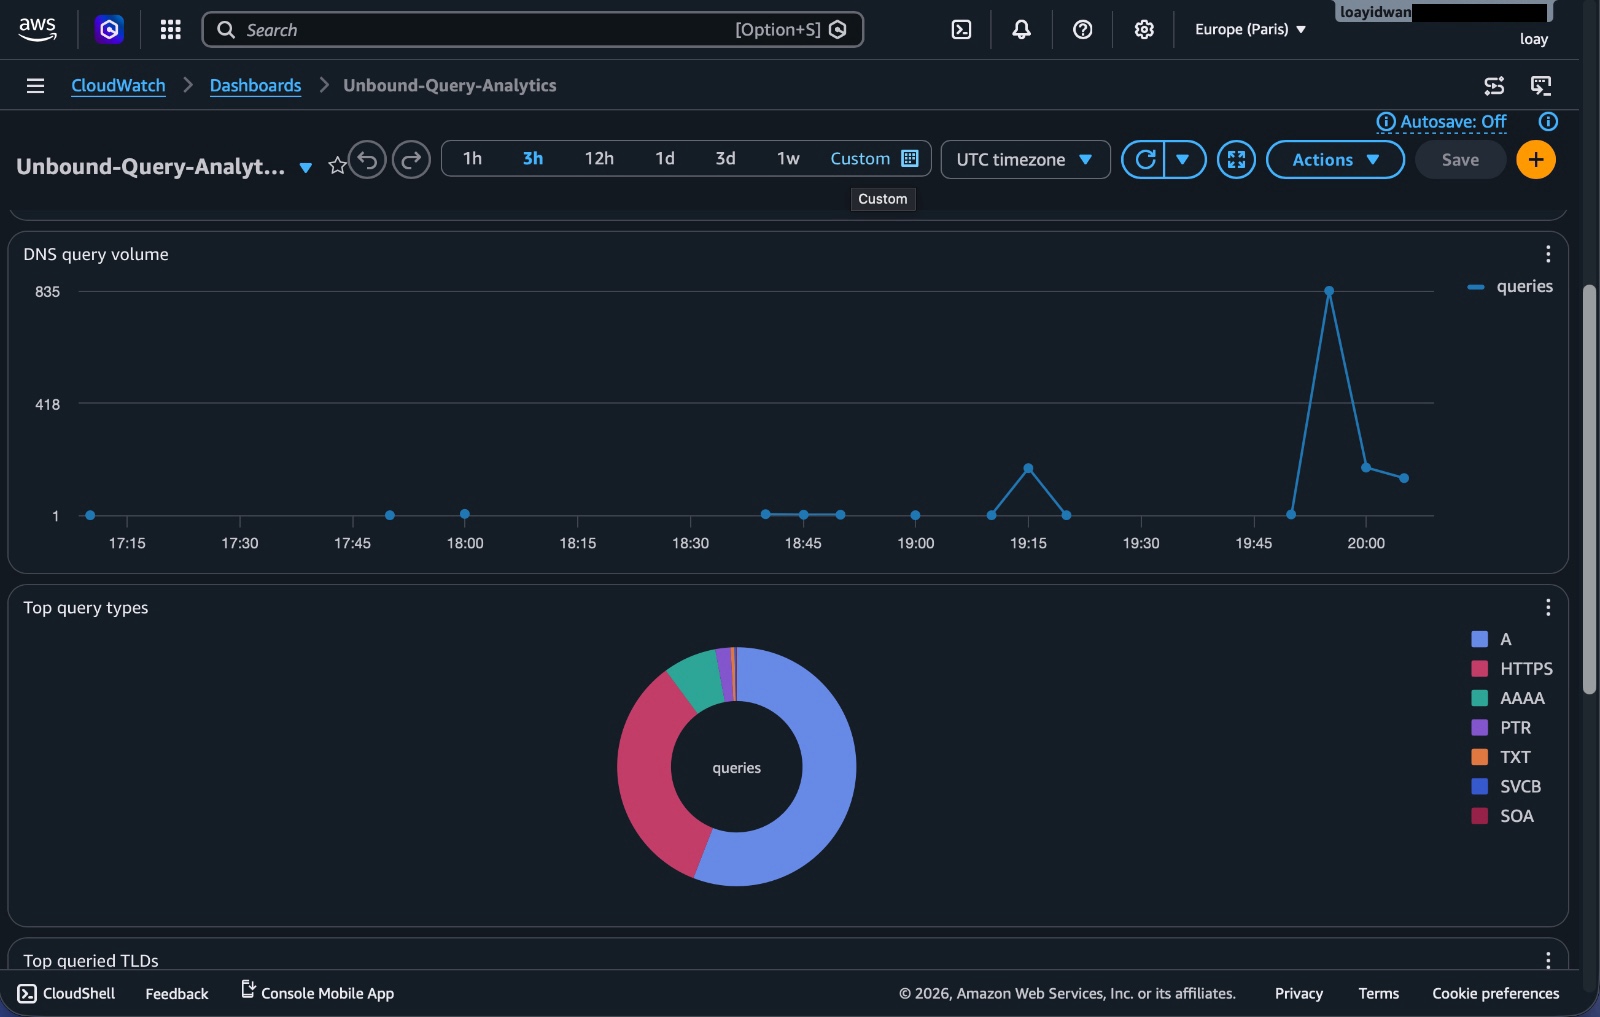
Figure 12. CloudWatch dashboard widgets for DNS query volume over time and query-type breakdown.
Top queried TLDs
fields @timestamp, @message
| filter @message like /info:/
| parse @message /info: (?<client>\d{1,3}(?:\.\d{1,3}){3}) (?<domain>[^ ]+) (?<qtype>[A-Z0-9]+) IN/
| parse domain /.*\.(?<tld>[^.]+)\.?$/
| stats count(*) as queries by tld
| sort queries desc
| limit 25
This groups queries by top-level domain.
Long TXT queries by client
fields @timestamp, @message
| filter @message like /info:/
| parse @message /info: (?<client>\d{1,3}(?:\.\d{1,3}){3}) (?<domain>[^ ]+) (?<qtype>[A-Z0-9]+) IN/
| filter qtype = "TXT" and strlen(domain) >= 40
| stats count(*) as queries by client
| sort queries desc
| limit 25
TXT records are normal, but long TXT style DNS queries can also be interesting from a security perspective. They can show up in verification flows, service integrations, or in less friendly cases, tunneling-style behavior.
For this project, I was not building a full DNS security product. I just wanted enough visibility to ask better questions.
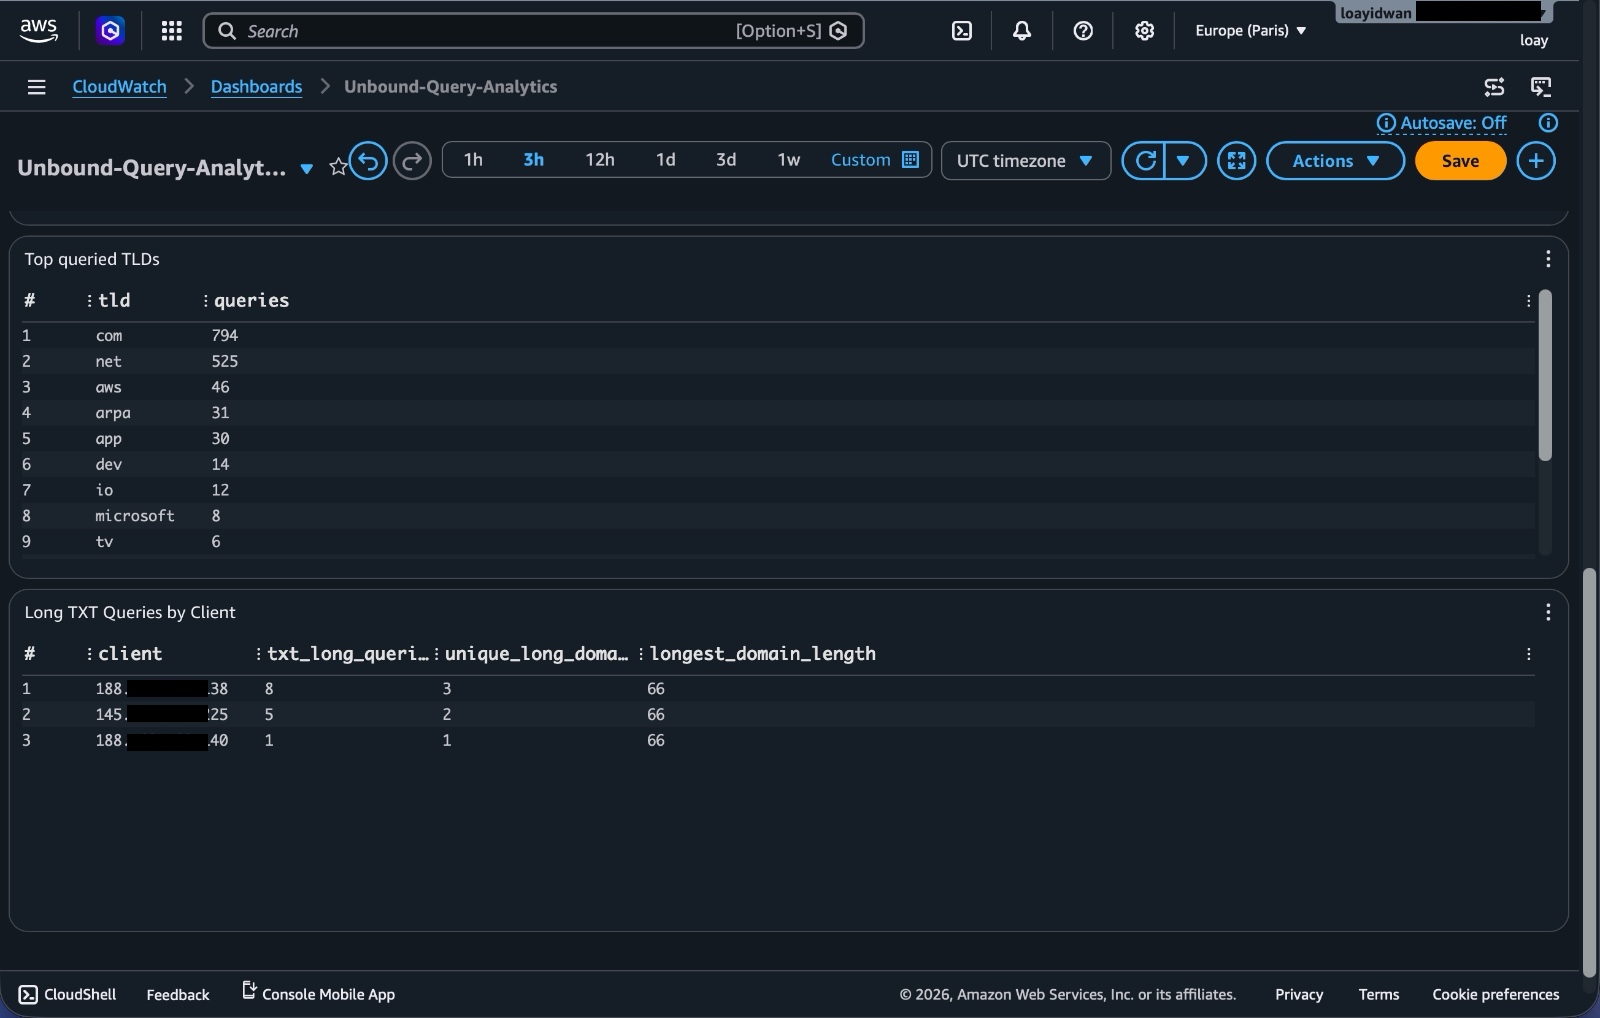
Figure 13. CloudWatch dashboard widgets for top queried TLDs and long TXT-query patterns.
What I learned
The biggest thing I learned is that DNS is confusing, to say the least.
I already understood DNS at the normal user level, domains turn into IP addresses, resolvers answer queries, caching makes things faster. Actually running a resolver made the details feel much more real. Query types, recursion, access control, resolver logs, source IP behavior, TXT records, and caching all matter more once you are the person responsible for the box answering on port 53.
The funny part is that the AWS side was probably the simpler part of the project once I understood the shape.
The Golden AMI, Launch Template, Auto Scaling Group, Target Group, and NLB all fit together in a fairly logical way:
- the AMI defines what the machine already has installed
- the Launch Template defines how to launch that machine
- the ASG decides how many machines should exist
- the Target Group tracks healthy resolver instances
- the NLB gives clients one stable DNS endpoint
The part that required more thinking was not clicking through AWS screens. It was understanding the behavior of the service I was exposing.
I also got a better appreciation for observability. Without the CloudWatch Agent and Logs Insights dashboard, the project would technically work, but it would be much less interesting. Once the query logs were centralized, I could actually see traffic patterns instead of just hoping the resolver was doing something useful.
Another lesson was that high availability is not only about having multiple instances. It is also about update behavior. If an ASG replaces instances in a careless order, you can still create downtime. Launch-before-termination style refresh behavior matters.
What I would improve next
There are a lot of things I would improve before treating this like a serious production ready service.
-
I would move the EC2 instances into private subnets. The NLB should be the public entry point, and the resolver instances should not need public IPs.
-
I would rebuild the whole thing with Infrastructure as Code using Terraform or CloudFormation. I built this as a learning project, but manually created infrastructure is harder to review, reproduce, and clean up.
-
I would make the client allowlisting stricter. The broad
0.0.0.0/0 allowUnbound rule was only for testing and should be replaced with a real allowlist. -
I would properly enable and validate DNSSEC.
-
I would add Route 53 or a custom domain in front of the NLB. During my testing, I queried the NLB DNS name directly. That works, but it is not the cleanest user-facing setup.
-
This version of the project does not use AWS Global Accelerator. It is a regional design, focused on high availability across multiple Availability Zones within a single AWS Region. A more advanced version could deploy the same resolver stack across multiple AWS Regions and place the regional Network Load Balancers behind AWS Global Accelerator. This would make the resolver globally reachable, improve latency for clients in different parts of the world, and provide regional failover. Global Accelerator would also provide two static Anycast IP addresses for clients to use, allowing AWS to route DNS traffic to the nearest healthy regional endpoint.
-
I would also add an automated AMI build pipeline. Manually maintaining a Golden AMI is fine for learning, but automation would make updates cleaner and less error prone.
-
For monitoring, I would add alarms for SERVFAIL spikes, sudden query volume increases, strange TXT query patterns, or clients that start generating unusual traffic.
-
Finally, I would think much harder about cost.
For this project, cost was not the main design constraint. I wanted to test AWS services and understand how they interact. In production, shipping semi-live DNS query logs into CloudWatch Logs can get expensive depending on volume. A cheaper version might dump logs to S3 daily or weekly and run analytics with Athena instead of keeping everything flowing into CloudWatch Logs in near real time.
Conclusion
This project was a good reminder that infrastructure is not just about launching servers.
The useful part was connecting the pieces, a Golden AMI for repeatable instances, a Launch Template and Auto Scaling Group for replacement and availability, a Network Load Balancer for a stable DNS endpoint, Unbound for the actual resolver, and CloudWatch for centralized visibility.
It gave me practice with AWS infrastructure, networking, high availability, observability, and the operational details around running a service that clients depend on.
It also made DNS feel a lot less theoretical.